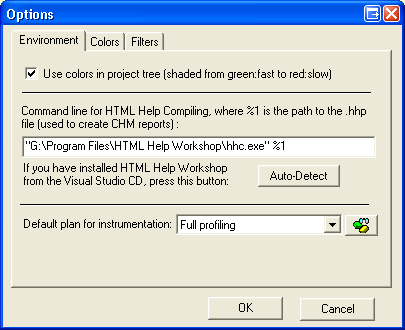

Use colors in project tree: determines if colors should be used in the project pane.
HTML Help: the Profiler needs a HTML Help compiler to produce .chm reports. Put your prefered compiler command line here. If you don't have one already, we suggest using HTML Help Workshop to be found on the Visual Studio CD, or to be downloaded here.
Default plan: select the plan that will be used for instrumentation with the Profile Project button.
Control Center: click the Control Center button to edit plans.

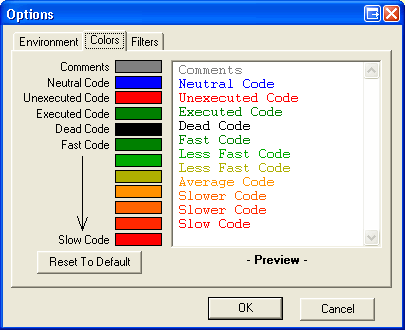
Colors: you may redefine colors used in the HTML source view. To define color, click in the rectangle and select a new color. To reset colors back to what they were originally, click the Reset button.
Dead code: reserved for future use with Project Analyzer Enterprise Edition.
Fast Code to Slow Code: the exact range for each color depends on the current display mode (time or child time; color by value or %) and is displayed at bottom of the HTML source view.

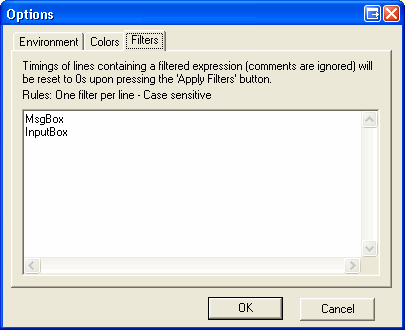
Filters: Filters are use to force timings to 0s for lines of code containing filtered expressions. For example, if you have a message box in your project that took 4 seconds to be closed, the line with the MsgBox will be credited 4s and that could ruin your analysis. You can apply filters anytime after a session is loaded.
Important: Filters do not apply to children timings since there is no way to know which line was counted as child of others. You will still see the original timings in children views and flow charts.
Note: Filters effects are not saved with the session file.You can still revert back to the original timings by unloading and reloading a session.